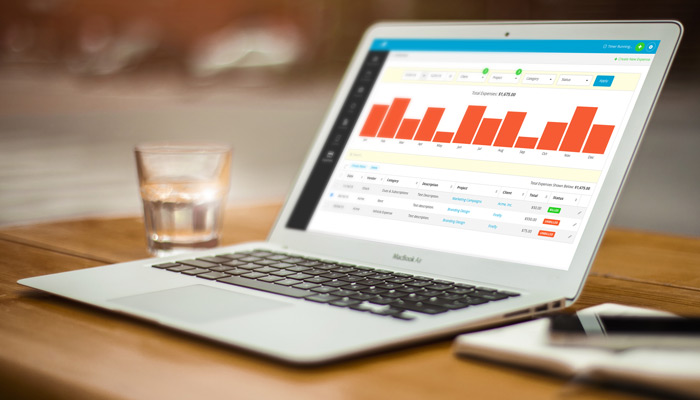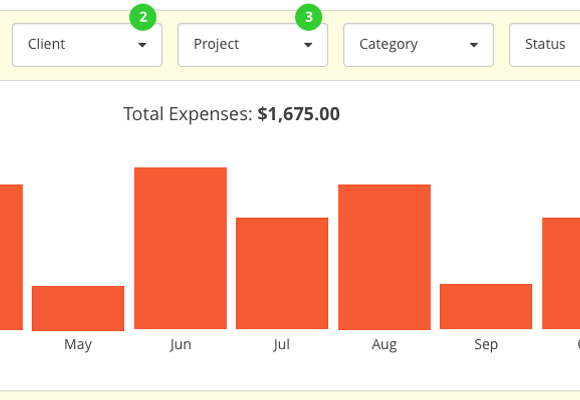
Your ability to filter and chart your business expenses in Harpoon just got a lot more powerful! For starters when viewing your Expenses screen you’ll notice a new set of filters at the top of the page. These filters enable you to customize the view of your expenses by a variety of criteria (custom date range, client, project, category, etc.).

The rest of the Expenses screen reacts to your filter criteria, starting with a new bar chart. The Expenses chart adapts its layout between daily, weekly, monthly, and yearly views based on your custom date range. Need to see how much you spent on office supplies last quarter? Or how much you spent on advertising and marketing last year? Easy. The new Expenses chart is a great way to see at a glance how much money your business has spent during any given unit of time.

Your expenses table list on the Expenses screen has also received some attention. Once you’ve filtered your expenses using the new filter bar at the top of the screen you can narrow things down even more with a new live search field above your expenses table list. As your search results narrow Harpoon will even calculate the total amount of those results in real time.
Need even more detail? Then you’ll want to check out our new Expense Report feature. With it you’ll have even more ways to view and organize your expenses, along with the ability to export your expenses in popular formats. Handy for sharing your business expense data with your accountant.
These updates pave the way for additional expenses features that are in the works. Stay tuned!


