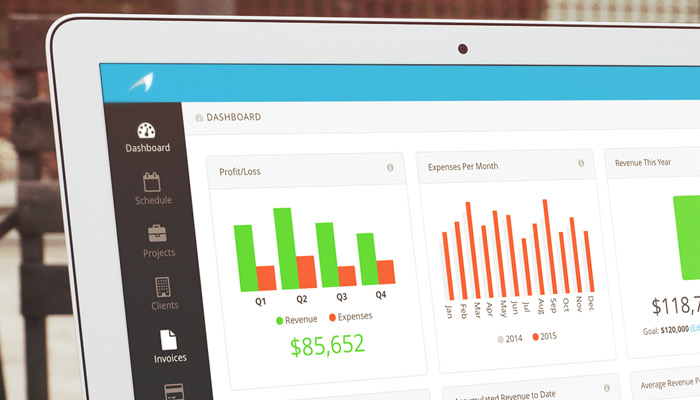
Since launching our new Expenses feature we’ve been working on some additional enhancements that take advantage of the expenses data in your account. Today we’re releasing two features in the form of new metrics widgets on your Dashboard.
Profit/Loss
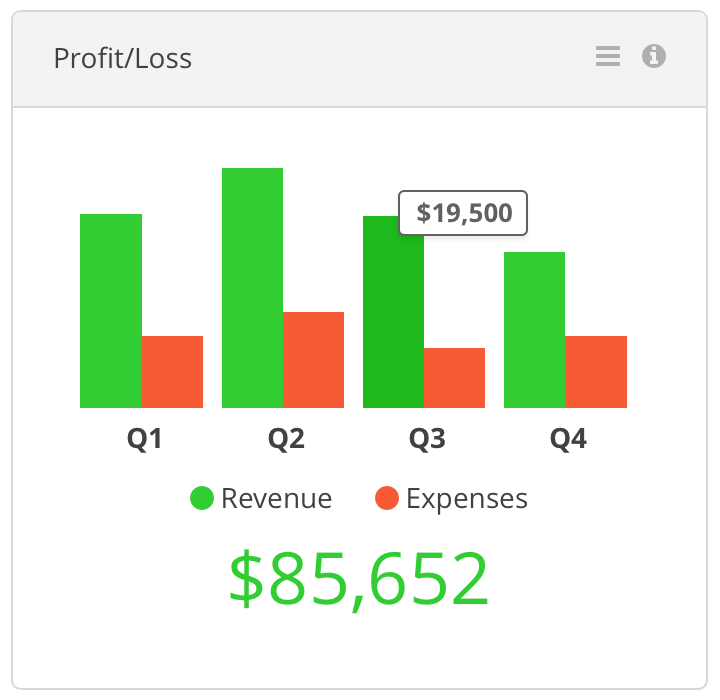
Harpoon has always displayed your profit/loss on a per project basis within your Project Details screens, but the new Profit/Loss widget on your Dashboard compares your quarterly revenue to your quarterly expenses across your entire account and provides your total profit/loss for the selected calendar year.
Expenses Per Month
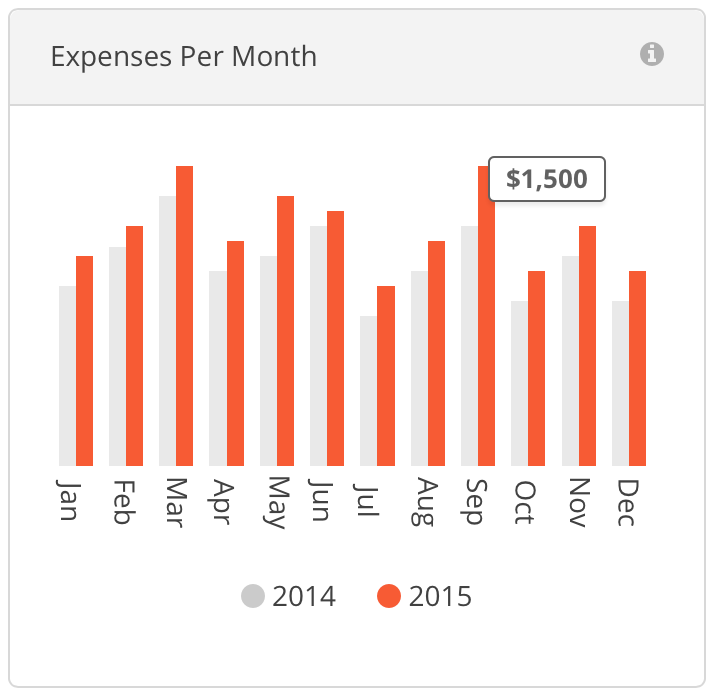
This widget displays your total expenses for each month of the currently selected year, compared to the corresponding months of the previous year. Hovering over any of the bars in this widget will display the totals for each bar.
And don’t forget, you can now rearrange your Dashboard widgets however you’d like. So if you’d rather have the new Profit/Loss widget at the top of your screen a simple drag and drop will do the trick.
We hope you find these widgets useful, and stay tuned for more features that take advantage of all the expenses you record in Harpoon!
