How do I use the Schedule?
The Schedule is one of the most powerful features in Harpoon. It's here where you’ll see your yearly revenue goal put into an actionable plan.
Project Scheduling
Projects appear on your Schedule according to the Start and End dates you gave a project when creating it. For example, if a project’s Start date is January 2019 and its End date is April 2019 you’ll see those months blocked out on the Schedule for that project.
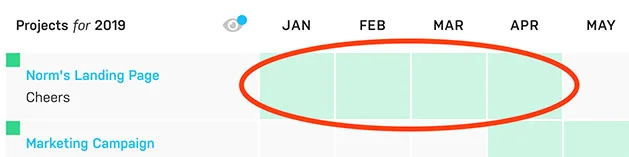
These dates can be changed at any time by editing your project and modifying the Start Date and End Date fields.
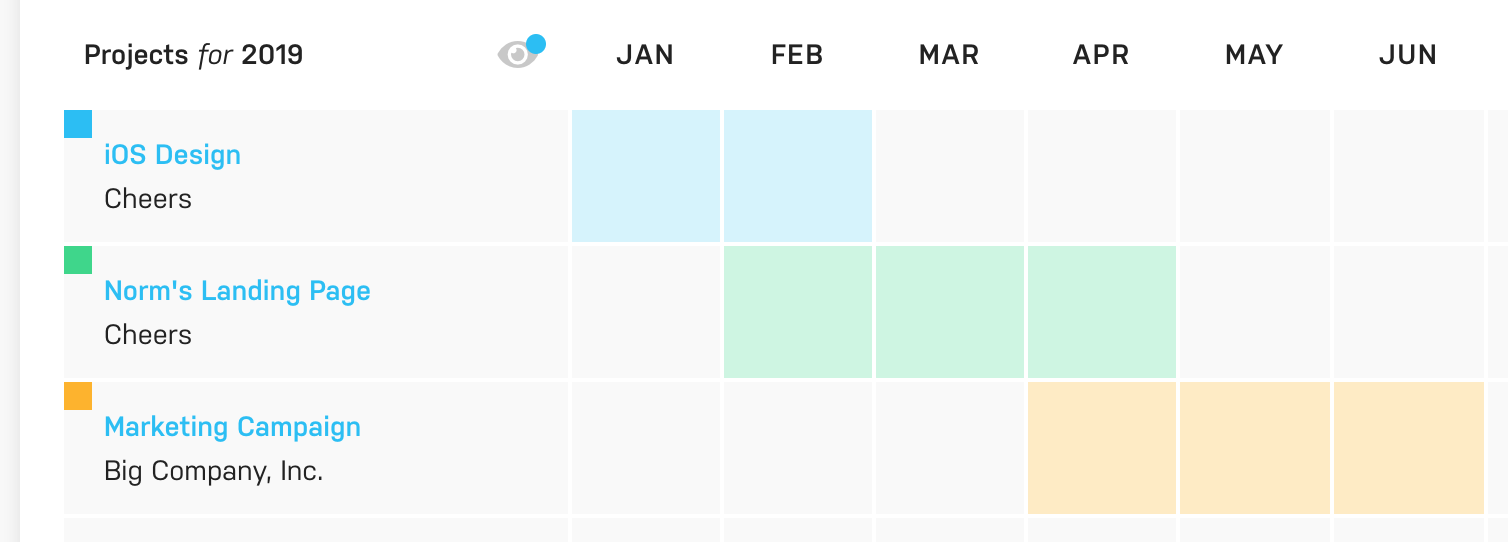
You’ll also notice that each project’s Status is represented on the Schedule by the colored squares next to the project names.
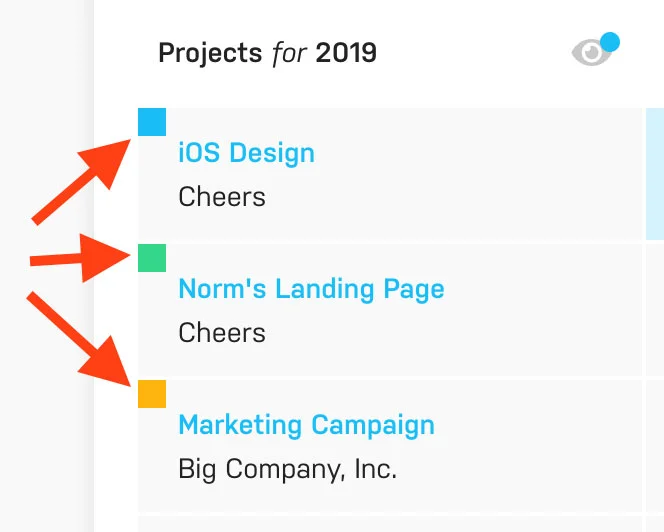
These project status colors are also extended to the block color fills on the calendar. (To learn more about project statuses view this article.) As you add projects to your Schedule it becomes a high level view of what you are (or plan to be) working on from month to month as the year progresses.
But the real power of the Schedule comes when you layer revenue tracking & forecasting on top of your project scheduling.
Revenue Tracking & Forecasting
Besides seeing how your projects are scheduled for the year, the Schedule also displays your tracked revenue for the year. There are two types of tracked revenue you’ll see displayed on your Schedule: Collected Revenue and Expected Revenue.
Collected Revenue: This represents all of the actual income you’ve received from your clients. Collected Revenue is represented by the solid green progress bar at the top of your Schedule (more about the progress bar in just a minute), and by the solid green circles within your Schedule’s calendar:

Expected Revenue: This represents all of the revenue you expect to receive, but haven’t received yet, which could include unbilled hours, unpaid invoices, future recurring invoices, fixed project budgets, or any expected revenue you've added manually using the "Add Expected Revenue" action at the top of your Schedule. (Refer to this article to learn more about these sources of expected revenue and how they work.) Expected revenue is represented by the striped green progress bar at the top of your Schedule, and by the striped green circles within your Schedule’s calendar:

Yearly Goal Progress Bar
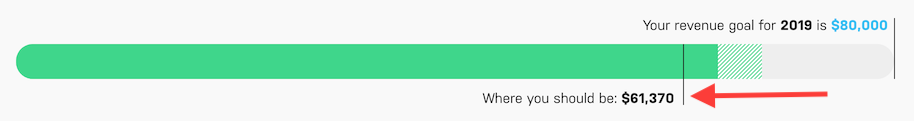
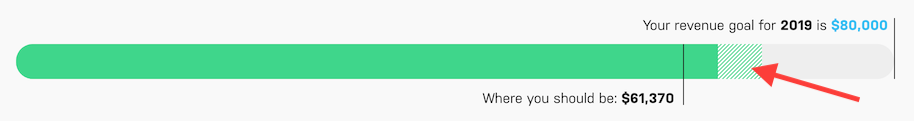
At the top of your Schedule screen is a yearly revenue goal progress bar. As you collect revenue from your clients throughout the year the solid green bar will grow as you get closer to meeting your yearly revenue goal:

You’ll also notice a dynamic “Where you should be” marker on the progress bar. Based on the time of year, this marker is how much collected revenue Harpoon calculates you should’ve received at this point in the year in order to stay on track to meeting your yearly revenue goal by the end of the calendar year:
You might also notice a green striped bar that extends past your solid green collected revenue bar. This striped bar represents your expected revenue, and shows you how far along you are to hitting your yearly revenue goal if you include all of your sources of expected revenue for the year:
The progress bar provides a quick, at-a-glance view of your goal progress. If you want to dig into the numbers that drive the progress bar you’ll want to look at the Monthly Progress row at the bottom of your Schedule.
Monthly Progress
You’ll find a row labeled “Monthly Progress” at the bottom of your Schedule:
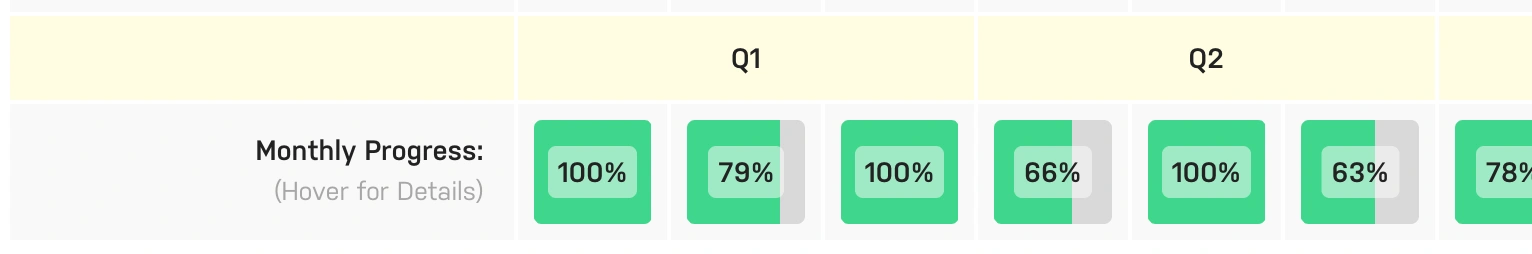
Harpoon takes your yearly revenue goal and breaks it up into a dynamic monthly goal. This monthly goal automatically adjusts itself from month to month based on how far ahead (or behind) you were from hitting your goal the previous month. The Monthly Progress row on your Schedule allows you to track this monthly goal activity. When you hover over a month in the Monthly Progress row you'll see more details. Let's look at a couple of examples:
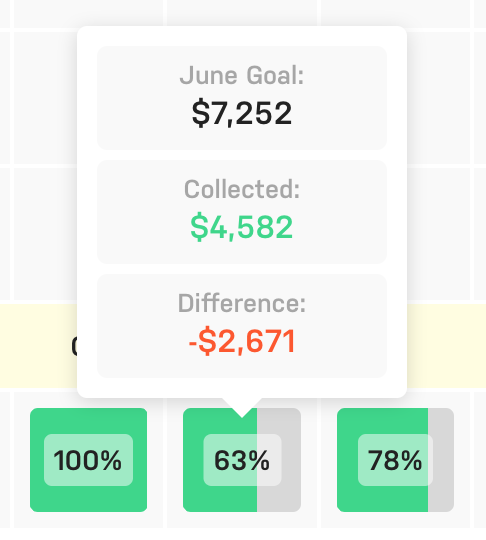
In the above screen shot we can see that in the month of June our monthly revenue goal was $7,252. We only collected 63% of our goal ($4,582) making a difference of -$2,671. But in the current month of October we're doing a bit better:

We can see in the above screen shot that our goal for the current month of October is $5,711. And although so far we've only collected 35% of our goal for this month ($2,000) we're actually expecting a total of $9,962 which will put us well past our goal.
Revenue Summaries
The Schedule also provides quick summaries of your collected and expected revenue. This feature is a bit hidden, but really comes in handy when you need it. Simply click any solid green (collected revenue) or striped green (expected revenue) circle on your Schedule and you’ll be greeted with a Revenue Summary overlay:
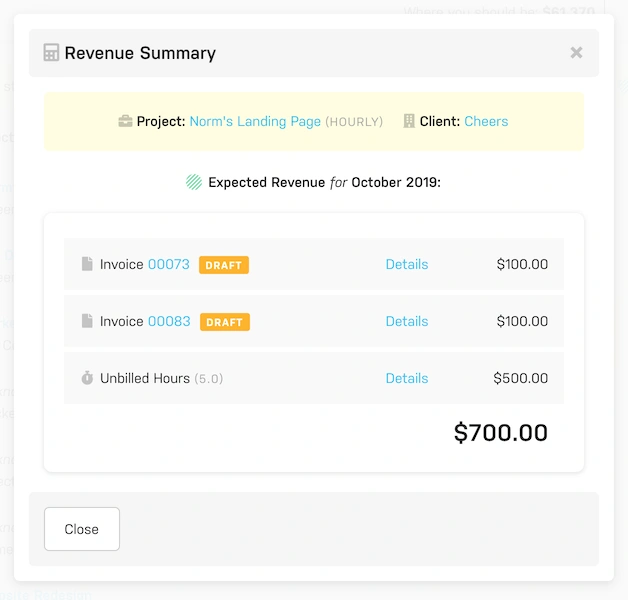
The Revenue Summary conveniently lists all the sources of collected or expected revenue represented by the circle that you clicked, along with a link to view further details of each source.
For more information about how to use the Schedule view the Schedule support articles.